
Graphical Representation of Motion
Graphical Representation of Motion: Overview
This Topic covers sub-topics such as Distance - Time Graphs, Scale on a Graph, Velocity - Time Graphs, Position - Time Graphs, Graphical Analysis of Motion, Acceleration in Displacement-Time Graphs and, Average Velocity in Graphs
Important Questions on Graphical Representation of Motion
Draw the velocity-time graph for an object moving with a constant velocity.
The following figure represents a position-time graph.
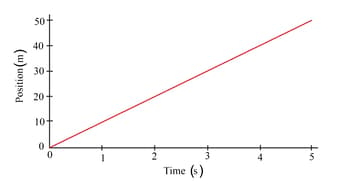
Calculate the total distance travelled by the object from the position-time graph.
The displacement-time graphs of two objects are given below in the following graphs.
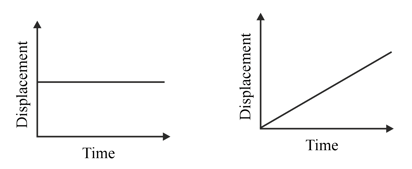
Compare the motions of the two objects by analysing the graphs.
List a few types of graphs which can fully explain the motion of an object.
Describe the process of calculating the average velocity from the position-time graph for a given time interval.
Define scale of a graph. Explain how to scale a graph according to the given data. Mention the importance of scale on a graph.
A car of mass is moving with a velocity of . If the velocity-time graph for this car is a horizontal line parallel to the time axis, then the velocity of the car at the end of will be:
The velocity-time graph for a body with non-uniform motion is a _____.


